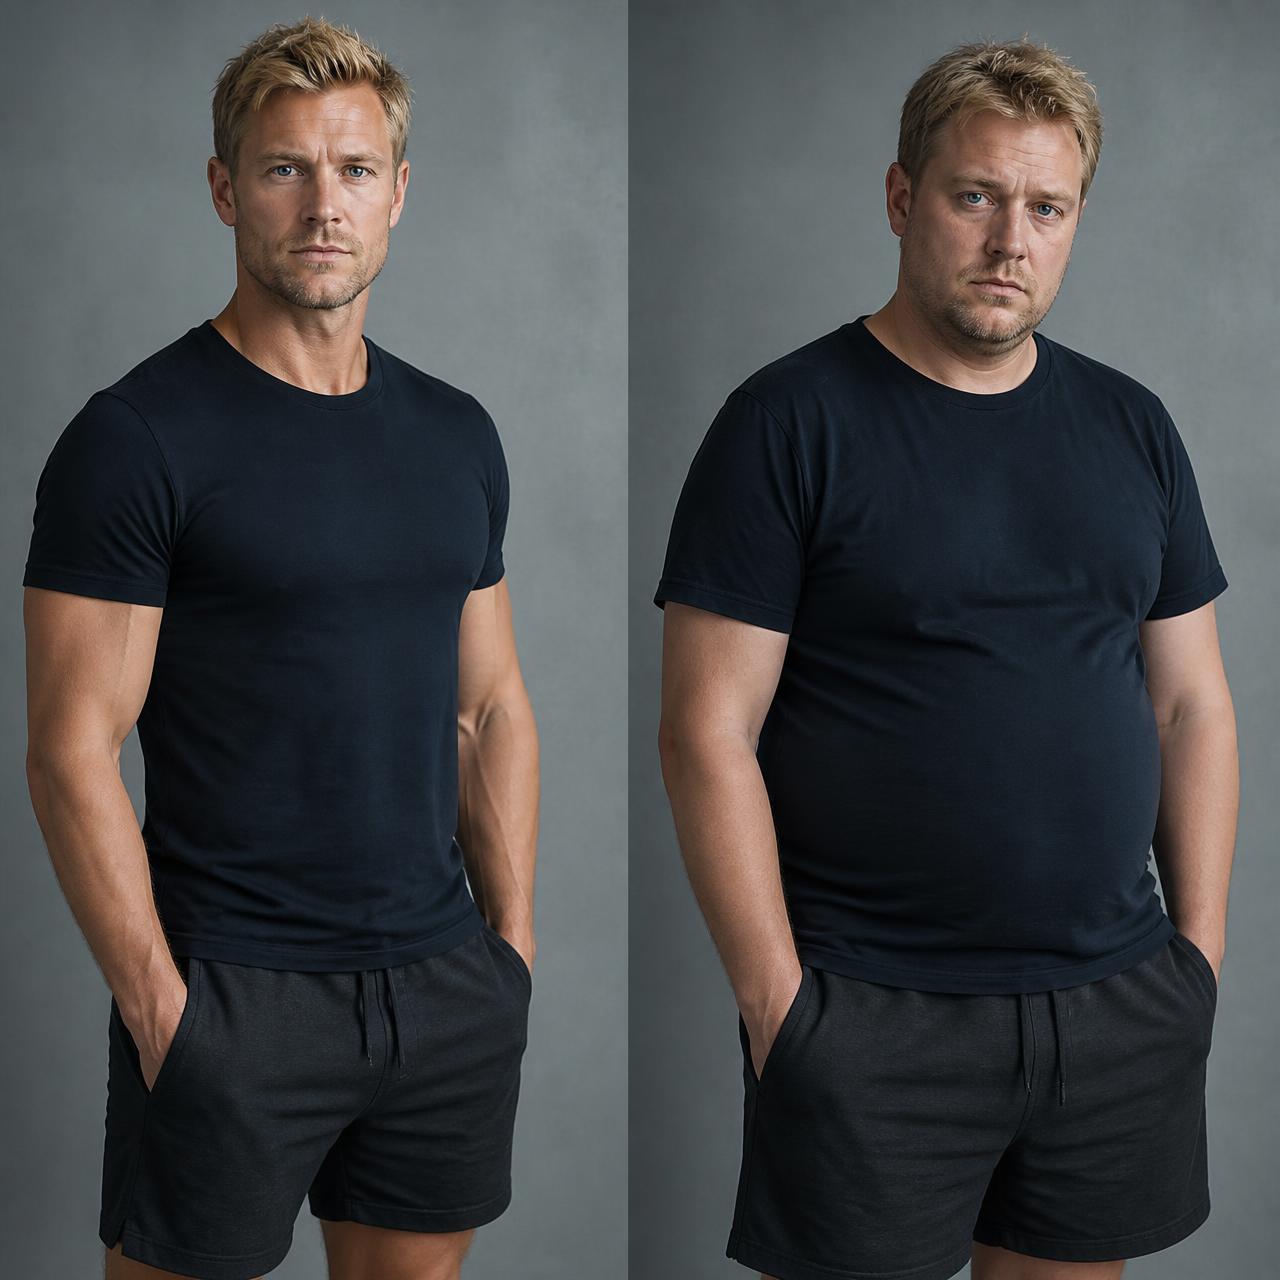
Symptom check
Does this sound like you?
- Lack of energy — the symptom that predicts low testosterone best (Scovell et al., 2015)?
- Motivation, drive and positive outlook fading?
- Strength, endurance and sports performance dropping?
- Work performance and focus deteriorating?
- Hard to build muscle — and belly fat that won't move?
- Libido, morning erections or erection strength declining?
Medical grade diagnostics delivered to your door. EU-wide shipping.
01 — The epidemic
Men are measuring lower than men of the same age did a generation ago — young men included.
The fall appears across independent cohorts in the US, Denmark and Finland, it shows no sign of flattening, and no European government measures it or raises the alarm. The consequences are wide: insulin resistance, weight gain, type 2 diabetes, muscle loss, osteoporosis, low mood or depression and premature ageing — in the young as well as the old.
Fall in the mean of same-aged men between 1987–89 and 2002–04 (MMAS, Travison et al. 2007) — about 1% per year.
nmol/L: population mean for men of the same age, 1987–89 versus 2002–04 (MMAS).
Burnout, depression, prediabetes, early sarcopenia — separate diagnoses for one unmeasured cause.
Once upon a time… Young and old had high T, throughout life.
Total and free testosterone across adulthood, the healthy-young reference range versus today's population average. Almost every symptom filed under “getting older” lies in the gap between these lines.
Clinical context
Total Testosterone vs. Symptom Ranges
Hover or focus a point for age, level and both unit systems.
Top 10% of healthy young men (measured)90th to 97.5th centile · Bhasin et al. 2011The blue band is the top decile of healthy non-obese men aged 19-40 — from the 90th centile (33.6 nmol/L) to the 97.5th (41.5 nmol/L, Bhasin et al. 2011) — carried across age with the BLSA age slope (Harman et al. 2001). The blue line is the mean of that top 10%, from 39.3 nmol/L at age 20 to 34.4 nmol/L at 70. The full spread of the same cohort, including the normal middle and the bottom 10%, is listed in the references.
Early / individual symptoms13–19 nmol/L · 375–548 ng/dLZitzmann et al. (2006) found the first symptom associations around 15 nmol/L: reduced libido, declining vigor and energy, weaker morning erections, poorer recovery after exercise, lower motivation and flatter mood. Symptoms are individual and relate to the fall from your own younger baseline — not a fixed cut-off.
Sexual symptoms become more likely11–13 nmol/L · 317–375 ng/dLBelow ~12–13 nmol/L the associations widen in Zitzmann et al. (2006) and EMAS: markedly reduced sex drive, erectile dysfunction, absent morning erections, reduced physical strength and endurance, growing belly fat, difficulty building or maintaining muscle, and increasing insulin resistance / prediabetic drift.
Marked deficiency range< 11 nmol/L · < 317 ng/dLBelow ~10–11 nmol/L every symptom group becomes strong and clustered: weight gain and increased fat mass (especially abdominal), loss of muscle mass and strength, metabolic problems including type 2 diabetes and metabolic syndrome, loss of bone density (osteoporosis), depression and low mood, chronic fatigue, sleep problems, hot flushes, reduced cognitive performance — and severely reduced libido, erection strength and fertility. This is the range where the hypogonadal-obesity cycle takes over: low T drives fat gain, and fat aromatises testosterone away, deepening the deficiency.
03 — The benefits
In studies, higher testosterone is associated with:
Taken together, this is one of the strongest anti-ageing and longevity levers in clinical medicine: muscle, bone, metabolism, cognition and drive all age with your hormone curve.
The reference point has quietly moved.
Laboratory “normal” ranges are drawn from a declining population. Measured against healthy non-obese young men in the Framingham cohort (Bhasin et al. 2011), today's average man sits far down that distribution.
| Period | Total T average | Total T, healthy young reference | Free T average | Free T, healthy young reference |
|---|---|---|---|---|
| 1987–89 · MMAS (Travison 2007) | 17.4 nmol/L | up to 41.5 nmol/L in healthy young men | 350 pmol/L | ≈ 500 pmol/L (derived) |
| 1995–97 · MMAS follow-up | 15.6 nmol/L | — | 310 pmol/L | — |
| 2002–04 · MMAS / NHANES onwards | 13.6 nmol/L | — | 270 pmol/L | — |
Where do your symptoms sit?
Symptoms correlate far more strongly with free testosterone than with total testosterone — the finding most standard consultations still miss.
High energy, sharp cognition, optimal muscle mass, robust libido and daily erections.
Stable energy, maintained muscle mass, normal metabolic profile, functional libido.
Mild fatigue, brain fog, slower recovery, belly fat tendency, fluctuating libido.
Severe fatigue, brain fog, muscle loss, insulin resistance, loss of libido and erections.
What the researchers actually wrote.
Three papers explain most of what men are told is simply age: where symptoms begin, why there is no single cut-off, and what happens to type 2 diabetes when the deficiency is corrected.
When symptoms actually begin
“Lack of energy appears to be the most important symptom that predicts a total testosterone level of 400 ng/dL (14 nmol/L) or below.”
Scovell et al. found that symptoms of low testosterone in young men, appear at a serum total testosterone threshold of 400 ng/dL (14 nmol/L) — well above the cut-off most European laboratories use. Alongside lack of energy was sadness, decreased strength and endurance, decreased ability to play sports and deterioration in work performance, which were most strongly predictive of low testosterone.
There is no single cut-off
“Prevalence of psychosomatic symptoms and metabolic risk factors accumulated with decreasing androgentestosterone levels. For example, prevalence of loss of libido or vigour, increased below testosterone concentrations of 15 nmol/L (P < 0.001), whereas depression and diabetes type 2 (also in non-obese men) were significantly more present in men with testosterone concentrations below 10 nmol/L.”
Zitzmann et al. widen the threshold further: the first symptoms appeared around 15 nmol/L, but the authors note there was no clear-cut boundary — some men experience symptoms earlier than others. Cluster analysis revealed ageing men to present within three independent groups, characterised by 1) psychosomatic complaints 2) metabolic disorders 3) sexual health problems
Remission of type 2 diabetes
“Testosterone therapy is potentially a novel additional therapy for men with type 2 diabetes and hypogonadism.”
Haider et al. followed 356 men with type 2 diabetes and testosterone below 350 ng/dL (12.1 nmol/L); 178 men received 1,000 mg testosterone undecanoate IM every 12 weeks. Treated patients showed significant, progressive and sustained reductions in both fasting glucose, HbA1c and fasting insulin. 34.3% achieved full remission of their diabetes and 46.6% achieved normal glucose regulation. In the testosterone group 83% reached the HbA1c target of 47.5 mmol/mol (6.5%) and 90% the target of 53 mmol/mol (7%).
The hypogonadal obesity cycle
Type 2 diabetes and metabolic syndrome are downstream problems that researchers describe as a consequence of low testosterone. First it becomes difficult or impossible to maintain muscle mass and body weight; fat mass increases, especially around the abdomen — which then suppresses testosterone further. Researchers call this vicious circle the hypogonadal obesity cycle.
This is why it is so interesting that raising testosterone reverses the loop and has even produced complete remission of type 2 diabetes. Note that these studies used sub-optimal administration — high peaks and deep troughs, at doses that must historically be considered mediocre. Despite this, the results were remarkable. It can be speculated whether results would have been faster, and would have covered a higher percentage of men, had the dose been higher and more frequent. Even so, it is of real interest whether all men with type 2 diabetes would benefit from optimising testosterone to a younger, historically optimal level.
Read the full evidence index →“For decades, low testosterone was ignored or feared. The real medical threat isn't restoring healthy levels; it's letting men suffer in silence with low testosterone.”
Are you experiencing these markers?
Don't guess. Measure.
Clinical optimisation starts with a validated assessment. Take the free symptom questionnaire and get an indication now, before you order a test.
04 — Your pathway
Take the international questionnaire and get your answer immediately.
The international symptom test
Two minutes, answered instantly. It maps your symptoms against the domains that track free testosterone.
Finger-prick test, LC-MS/MS
If the test indicates low T, confirm it. Our at-home finger-prick kit is analysed by mass spectrometry and tells you exactly where total and free testosterone sit. €75.
Order the testConsultation and prescription
After the analysis a consultation is set up where the doctor concludes on your symptoms and your bloodwork — and issues a prescription where therapy is indicated.
Book a consultation — €49“Treat the patient, not the paper. A blood test gives you a number, but the man sitting in front of you gives you the reality.”
Already in treatment?
Mediocre results from old-fashioned methods or fluctuating hormone levels?
If your protocol peaks around 20 nmol/L and crashes to 10–15 before the next injection, you feel the trough more than the treatment. We offer more optimal testosterone forms with minimised troughs — thin, additive-free preparations without allergenic or inflammatory carrier oils, given with the finest subcutaneous insulin needles. Creams are of course also available.
Move your treatment to us →For women
Women lost the same baseline.
Oestrogen falls up to 90% through menopause while testosterone falls roughly 50% — reshaping the ratio that governs bone density, muscle tone, cognition and libido. See the female charts, the free testosterone symptom bands and the micro-dosing protocol.
Women's hormonal status →What changes at optimal levels.
Targeting the upper optimal spectrum — rather than merely clearing a lowered laboratory floor — is where the documented clinical benefit lives.
Visceral fat reduction
Testosterone directly inhibits abdominal lipid storage and enhances lipolysis. Belly fat shrinks where diet alone stalled.
Muscle mass & bone density
Protein synthesis and myonuclear accretion scale with hormone level, reversing age-related sarcopenia and arresting bone loss.
Insulin sensitivity
Studies show up to a 32–35% increase in tissue glucose uptake in response to insulin — testosterone acts as a potent insulin sensitiser.
Diabetes remission
In long-term registries with up to 11 years of follow-up, approximately 34% of hypogonadal men with type 2 diabetes reached full remission.
Cognition & mood
Restored drive, concentration and emotional stability — the symptoms most often misattributed to burnout.
Cardiometabolic resilience
Physiologically high free testosterone protects against visceral fat, low-grade inflammation and insulin resistance.